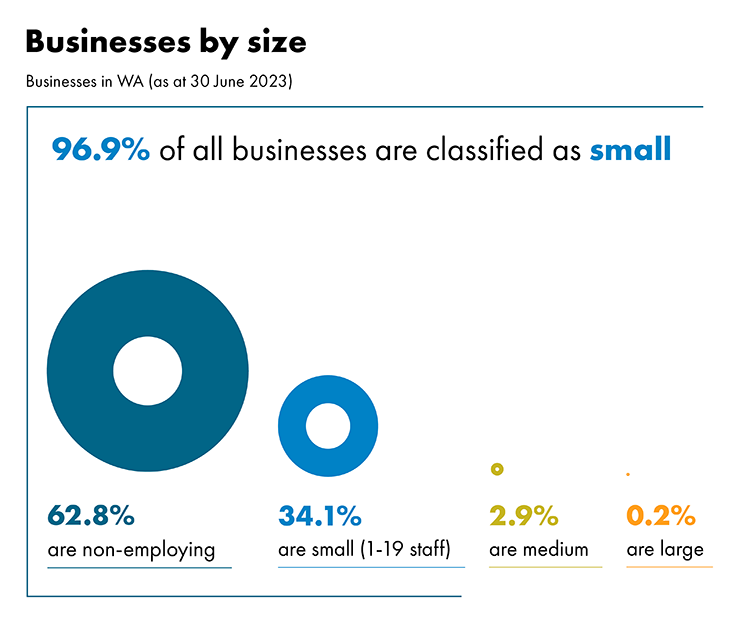
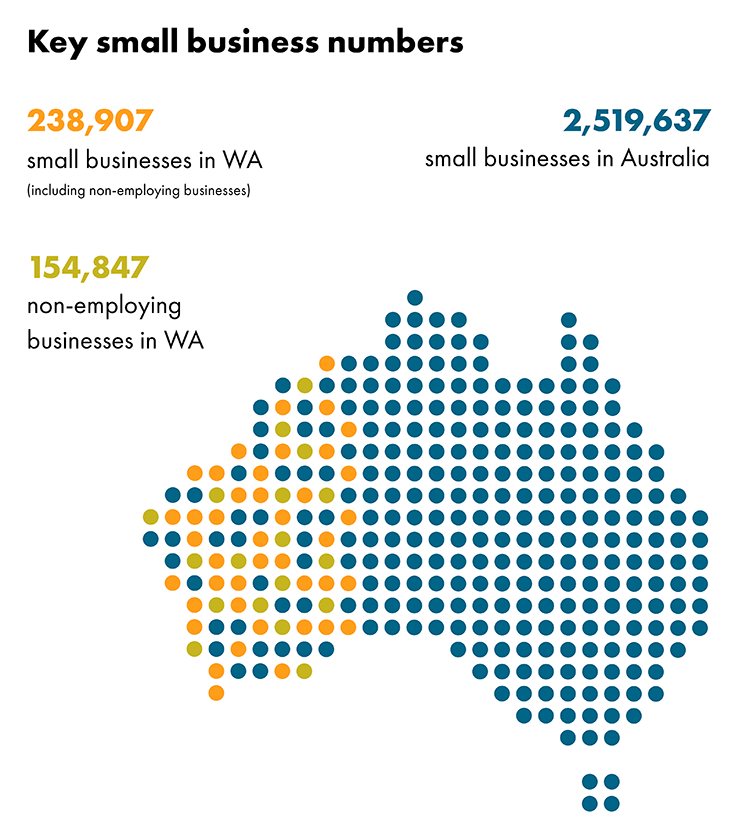
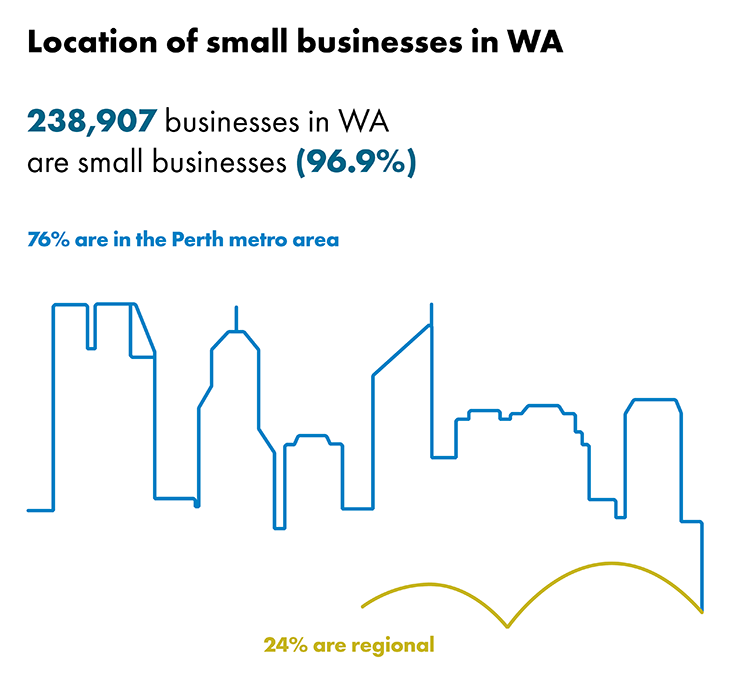
Small business in Western Australia at a glance
Image
Image
Image
Image
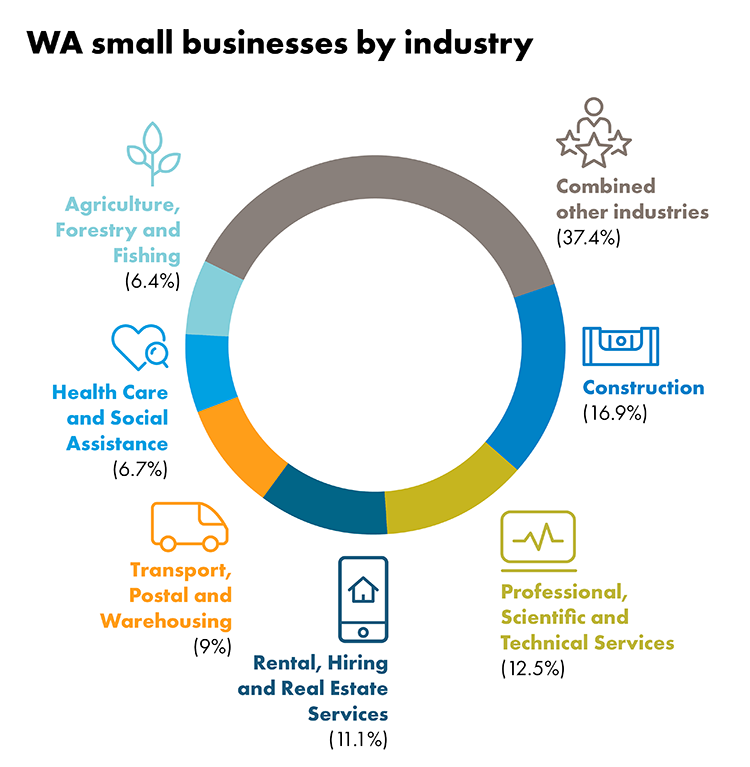
Notes on statistics
- Statistics as of 30 June 2023.
- Source: Australian Bureau of Statistics - Counts of Australian Businesses, including Entries and Exits.
- In relation to the statistics, the SBDC uses the standard Australian Bureau of Statistics (ABS) definition of small business, which is any non-employing business or a business employing fewer than 20 people. However, for legal purposes, the definition of a small business is as stated in the Small Business Development Corporation Act 1983.
- As with any analysis based on data sets it is subject to a degree of error. Individual numbers or percentages should not be used as absolutes.
- Statistics include only those businesses actively remitting Goods and Services Tax (GST). As such, small businesses not registered for GST are not captured in this data.
Other helpful resources